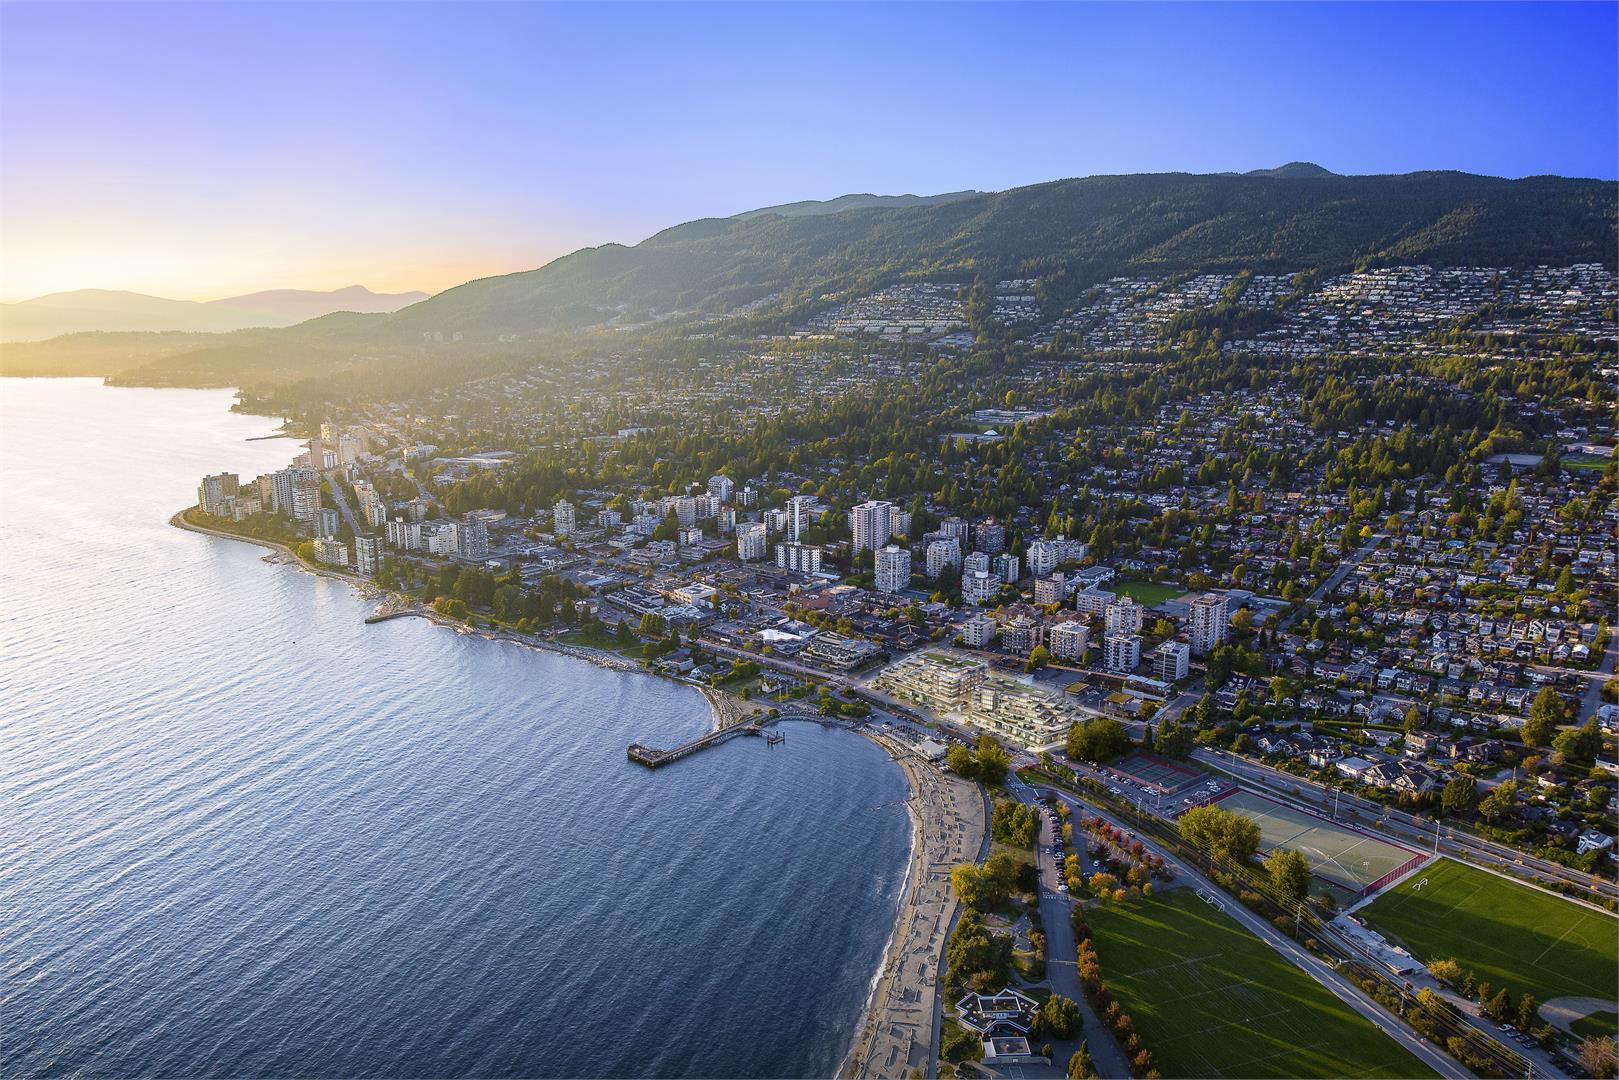

2018 Real Estate Review
Firstly, Happy New Year! 2018 was certainly a year of change for the Vancouver Real Estate market. Changes with financial terms and lending restrictions to new taxes implemented, and a shift in pricing and volume, I feel as though it has left the public perplexed. In order to help make sense of the last year, here is a quarterly summary of what the 2018 real estate market looked like.
At the beginning of the year, we saw many regulations and tax changes, which greatly affected sale prices and volume. By the second quarter, sellers were still hanging onto the record prices that we saw in late 2017, not quite ready to adjust when the market changed. This led to longer days on the market and fewer sales. Properties that were priced sharply still saw multiple offers, but those priced on the high end were virtually at a standstill. Buyer mentality changed as well as inventory began to build throughout the year, with purchasers hoping to get properties at a discount. By the final quarter, sales were down about 42.5%, while the total number of homes listed were up 42.1% compared to the same time in 2017. Home sales across Metro Vancouver in 2018 were the lowest annual total in the region since 2000.
So overall, what does this mean? Well, it is a great time for buyers to move up in the market and for first-time buyers to finally get in. Although times have certainly changed, there is an incredible opportunity for investment and advancement, you just need to play the right cards. If you’re thinking of selling and wondering what your home is worth in today’s market, please give me a call. BC assessments were released, however, tax assessed value doesn’t necessarily mean market value.
First Quarter
- At the beginning of the year, the government increased the foreign buyer tax to 20% from 15%
- The province also implemented a new speculation tax on residential properties, targeting foreign and domestic homeowners who don’t pay income tax in BC. This includes those who leave homes vacant
- The tax rate increased $5 per $1,000 of assessed value
- Property Transfer Tax on residential properties above $3 million increased to five per cent from three per cent
Second Quarter
- 29.7% decrease in sales comparing March 2017 to March 2018
- 14% increase in sales compared to February 2018
- Benchmark price for all residential properties in Metro Vancouver was $1,092,000. This represents a 14.3% increase over April 2017 and a 0.7% increase compared to March 2018
- Sellers were hanging onto the record prices that we saw in late 2017, not quite ready to reduce. This led to longer days on the market and fewer sales.
Third Quarter
- July 2018 had 30% fewer sales than July 2017
- July 2018 had the fewest number of sales in any July since 2000
- By August, sales were 25% below the 10 year August average
- In September, sales were 46% below the 10-year average and 44% less than last September
- Prices are still up nearly 7% since a year ago, but they are down from the second quarter
Fourth Quarter
- At the beginning of the quarter, sales were 26.8% below the 10-year October sales average
- Home listings at four-year October high as sales remain below typical levels
- The total number of homes listed for sale on the MLS® system in Metro Vancouver is 12,984, a 42.1%increase compared to October 2017
- By November, sales had decreased by 42.5% compared to November 2017, with an 18.2% decrease compared to October 2018
- Last month’s sales were 34.7% below the 10-year November sales average and were the lowest sales for the month since 2008